This indicator was first introduced in my June 2004 article in Technical Analysis of STOCKS & COMMODITIES.
The VFI is based on the popular On Balance Volume (OBV) but with three very important modifications:
- Unlike the OBV, indicator values are no longer meaningless. Positive readings are bullish and negative bearish.
- The calculation is based on the day’s median instead of the closing price.
- A volatility threshold takes into account minimal price changes and another threshold eliminates excessive volume.
- The indicator takes into account only the latest 6 month volume action and not the entire data loaded in the chart.
A simplified interpretation of the VFI is that values above zero indicate a bullish state and the crossing of the zero line is the trigger or buy signal.
The strongest signal with all money flow indicators is of course divergence.
The classic form of divergence is when the indicator refuses to follow the price action and makes lower highs while price makes higher highs (negative divergence). If price reaches a new low but the indicator fails to do so, then price probably traveled lower than it should have. In this instance, you have positive divergence. This indicator is also very useful for improving performance results in trading system design. In fact I have used it in a number of my Amibroker and Metastock systems .
EXAMPLES

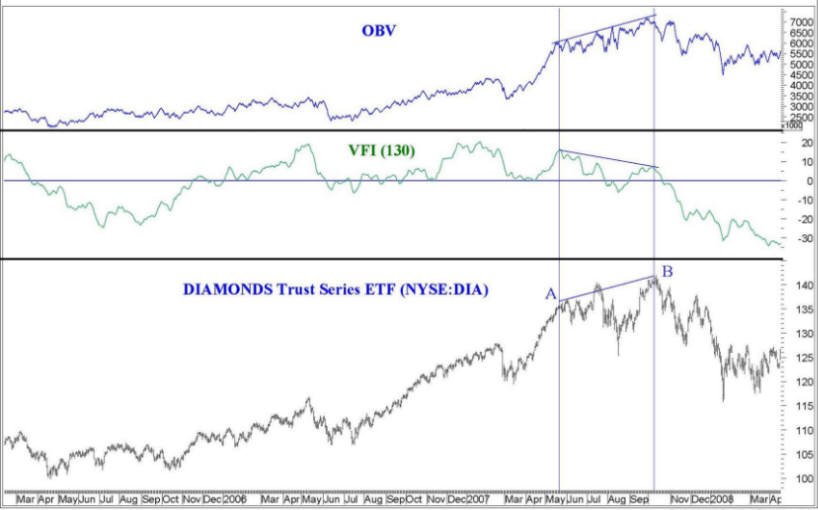
Daily chart of the DIA ETF (a proxy for the Dow Jones Industrials) with the On Balance Volume in the top window (in blue) and the VFI (green) in the middle window.
Notice the negative divergence between DIA and the VFI at points A and B at the market top in the beginning of September 2007 just before the sub-prime crisis meltdown.
Period = Param(“VFI Period”, 130, 26, 300, 10 );
Smooth=Param( “SMOOTH”, 3, 1, 10, 1 );
MAP=Param( “MA Period”, 30, 20, 100, 10 );
Coef = 0.2;
VCoef = Param(“Vol Cutoff”, 2.5, 1, 5, .5 );
inter = log( Avg ) – log( Ref( Avg, -1 ) );Vinter = StDev(inter, 30 );
Cutoff = Coef * Vinter * Close;Vave = Ref( MA( V, Period ), -1 );
Vmax = Vave * Vcoef;Vc = Min( V, VMax );MF = Avg – Ref( Avg, -1 );
VCP = IIf( MF > Cutoff, VC, IIf ( MF < -Cutoff, -VC, 0 ) );
VFI1 = Sum( VCP , Period )/Vave;
VFI =EMA( VFI1, smooth ); MAVFI=MA(VFI,MAP);
dynamic_color = IIf( VFI >= 0, colorGreen, colorRED ) ;
Plot( VFI, “VFI(” + PERIOD + “)”, dynamic_color, styleThick );
Plot( MAVFI, “”,colorGREEN, styleDashed );
PlotGrid( 0, colorBlue );
Another noteworthy volume based indicator is Sibbet’s Demand Index. It uses price and volume to assess buying and selling pressure affecting a security. You can find detailed information about it in https://precisiontradingsystems.com/Demand-Index.html
