If you use both an interday indicator (such as the OBV) and an intraday (such as Chaikin’s money flow or intraday intensity) you might have noticed that they sometimes move in opposite directions.
This is because intraday money flow indicators leave out all price action from the close to the next day’s open. This omission should not be ignored, since major news such as earnings announcements are usually released overnight. You can find examples of contradicting signals between the OBV and CMF in my April 2003 and July 2011 articles in S&C.
To reconcile both methods I designed a money flow indicator which takes into account both intra and interday price action and presented it in the April 2003 issue of S&C. In designing the FVE, I also introduced a volatility threshold that excludes minimal price changes.
The FVE provides 2 types of signals:
- The strongest signal is divergence between price and the indicator. Divergence can provide leading signals of breakouts or warnings of impending corrections. The classic method for detecting divergence is for FVE to make lower highs while price makes higher highs (negative divergence). An alternative method is to draw the linear regression line on both charts, and compare the slopes. A logical buy signal would be for FVE, diverging from price, to rise sharply and make a series higher highs and/or higher lows.
- The indicator level is a unique and very important property of this indicator. Values above zero are bullish and indicate accumulation while values below zero indicate distribution. FVE crossing the zero line indicates that the short to intermediate balance of power is changing from the bulls to the bears or vice versa. The best scenario is when a stock is in the process of building a base, and FVE diverges from price and rises to cross the zero line from below, at a sharp angle. Conversely the crossing of the zero line from above is a bearish signal to liquidate positions or initiate a short trade.
When using this indicator keep in mind that unlike the VFI, the FVE is more appropriate for short term trading.
You can find a money flow divergence system using both FVE and VFI here and a comparison between 7 Money Flow Indicators in my article in the July 2011 of S&C.
EXAMPLES

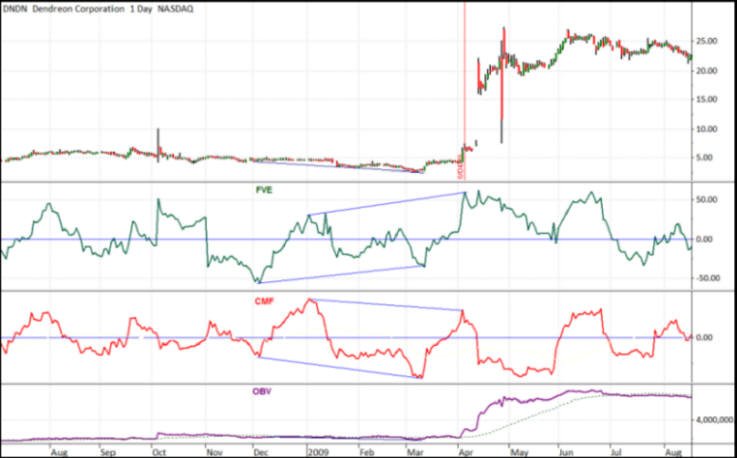
On 4/10/09 (US Date Format) Dendreon Corporation (NASDAQ: DNDN) gapped up on positive news about its prostrate cancer drug. You can see here the discrepancy and conflicting signals between the FVE (in green), the CMF (in red) and the OBV (in purple).
The FVE, diverging from price, made a higher high a few days earlier (4/6/09) and a higher low almost a month earlier (3/12/09) whereas the CMF made lower highs and lower lows and the OBV moved horizontally.

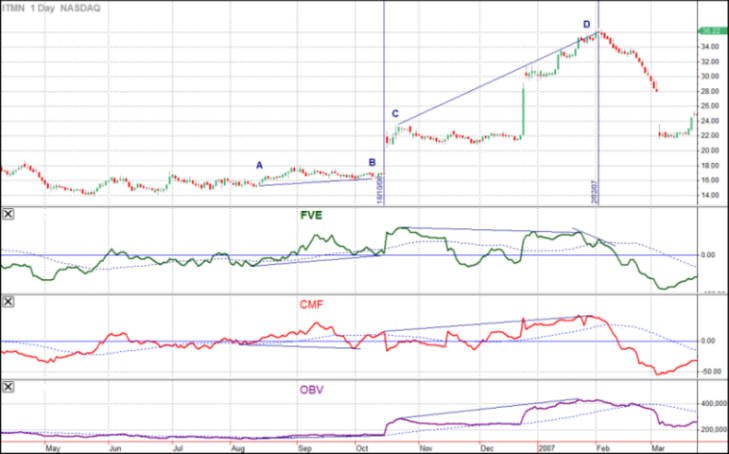
Daily chart of Intemune (NASDAQ :ITMN) with 21 day FVE (in green) , 21 day CMF (in red) and OBV (in purple) at the bottom window.
Here you can see two instances of conflicting signals between, an Intraday Indicator (CMF) , Interday (OBV) and a hybrid indicator (FVE).
On 10/11/06 (point B) , a few days before the breakout, FVE made a higher low while CMF made a lower low. The OBV moved horizontally providing no clue of the impending breakout.
In another instance, three months later (point D on 2/2/07) both the CMF and the OBV followed price closely making higher highs and providing no warning of the imminent catastrophic breakdown. On the other hand the FVE made lower lows , crossing below its 40 day moving at the top (point D).


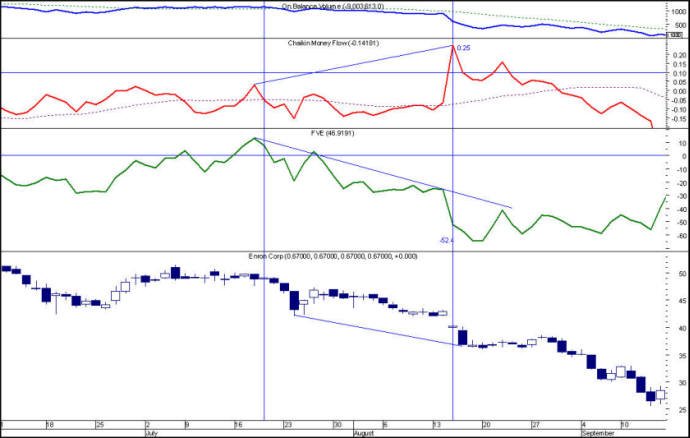
Only FVE (in green) predicted correctly the heavy insider selling while Enron was still at the 40’s. We all know what happened next.
The conflicting and sometimes misleading signals between Intraday Indicators (such as the CMF) and Interday (OBV) was the main reason that I devised the FVE which takes into account both interday and intraday price action. In my original article I provided the above and another two examples of conflicting signals between the FVE, CMF, OBV.
I was surprised therefore to see, a year later, an article by Andrew Tomlinson -A tale of two Indicators- published in the October 2004 issue of Technical Analysis of stocks and Commodities and two years later another article by George Siligardos- Spike Up the Volume- published in the June 2005 issue, pointing out essentially the same thing .
Both authors provided examples of conflicting signals between the CMF and the OBV but none had the courtesy to mention my 2003 article.
Period = Param(“FVE period”, 22, 10, 80, 1 );
Coeff=Param(“CoefF for Cutoff”,0.1,0,2,.01);
MAD=Param(“FVE MA”,30,5,200,5);
Intra = log(H)-log(L);
VIntra=StDev(Intra,Period);
Inter=log(Avg)-log(Ref(Avg,-1));
VInter=StDev(Inter,Period);
Cutoff=Coeff*(VInter+VIntra)*C;
MF = C – (H+L)/2 + Avg – Ref( Avg, -1 );
Vc = IIf( MF >cutoff, V,IIf( MF < -cutoff, -V, 0 ) );
FVE = Sum( Vc, Period )/MA( V, Period )/Period * 100;
MAFVE=MA(FVE,MAD);
Plot(FVE,”FVE”,colorGREEN,STYLETHICK);
Plot(MAFVE,”MA”,colorGreen,STYLEDASHED);
Plot(0,”0″,colorBLUE);
